- Products

- Developers
- User stories
- Blog
- Pricing

Low latency, large working set, and GHC’s garbage collector: pick two of three

Pusher makes it easy for developers to reliably deliver data at scale. A few features we are working on required a rewrite of our internal message bus, but we knew anything we build has to perform as reliably as the existing platform. Our chosen language for this job was Haskell, compiled with GHC. Haskell, unusually \[…\]
Introduction
Pusher makes it easy for developers to reliably deliver data at scale. A few features we are working on required a rewrite of our internal message bus, but we knew anything we build has to perform as reliably as the existing platform. Our chosen language for this job was Haskell, compiled with GHC. Haskell, unusually obsessed with correctness, was a good choice for our focus on reliability. GHC was a good choice as a compiler with a reputation for good performance. But our performance tests showed that our new implementation had performance problems. It suffered from high worst-case latency: the time between sending and receiving a message could be in the hundreds of milliseconds.
This blog post documents our investigation of these latency problems. Our findings have some implications for designing similar systems using GHC.
The message bus
Conceptually, our in-memory message store is a buffer. New messages get pushed on one end, and old messages get popped off at the other. Systems can ask for the message history without popping them off, so the process must also be able to traverse the buffer efficiently.
Performance testing the message bus
After implementing this system, we implemented some comprehensive performance tests. Two performance characteristics we care about are throughput and latency. Throughput means messages per second, and latency means the time between sending a message and receiving it. We pushed millions of realistic messages through the system, measuring the latency of each message using wall-clock time. Finally, we charted the distribution of these using the statistics package.
Pusher’s existing message bus has high throughput and low latency. Our replacement has to achieve the same low latency, but our tests showed that the 99th percentile latency was surprisingly high. Most messages traversed the new system within 5 milliseconds. But a significant few took several hundreds of milliseconds. This is too high for Pusher’s realtime platform, which currently achieves a 99th percentile of around 100 milliseconds.
What was causing this poor worst-case? To investigate, we needed more visibility of what our program was doing. GHC provides some good observability tools. One of these, ThreadScope, gives you a microsecond-level visual history of one run of your program. Here’s the chart of one run of our performance benchmark:
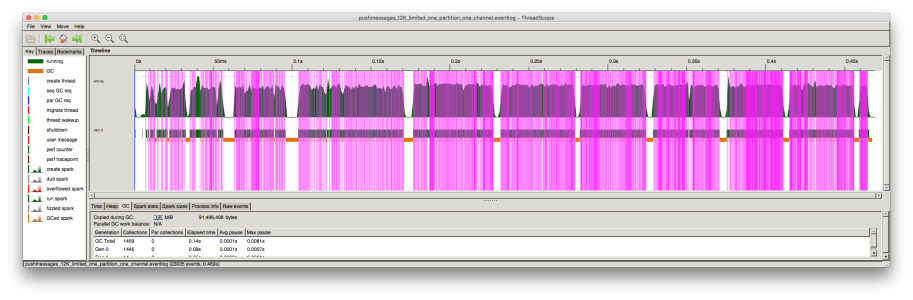
The chart shows the history of one run of our benchmark program. Time runs along the x-axis. The pink lines mark when the system receives messages, and so the blocks of pink lines are periods of ‘productive’ work.
What are those large gaps between sections of productive work? They represent the cause of the worst-case latencies in our tests. During these periods, sent messages were waiting to be forwarded.
The chart marks garbage collection cycles in orange, each around 8 milliseconds long. These sections exactly correspond to the periods where our program did no work! All our pauses were due to garbage collection.
Isolating the garbage collection pauses
The question we needed to answer was: what determines the length of a garbage collection pause? We took two approaches to answering this: white box and black box. Black box testing meant fiddling with our benchmarks, watching the change in garbage collection pauses. White boxing meant understanding the garbage collector in the GHC runtime.
Our black-box tests simplified our program to the simplest case which exhibited these latencies. Our real-world program can hold many interrelated buffers, with messages of many sizes, which are expired by multiple policies. The simplified program just works with 1-kilobyte messages in a Data.Map.Strict, indexed by send time. It inserts new messages in time order, and pops old ones off, to limit the structure at 200,000 messages:
module Main (main) where
import qualified Control.Exception as Exception import qualified Control.Monad as Monad import qualified Data.ByteString as ByteString import qualified Data.Map.Strict as Map
data Msg = Msg !Int !ByteString.ByteString
type Chan = Map.Map Int ByteString.ByteString
message :: Int -> Msg message n = Msg n (ByteString.replicate 1024 (fromIntegral n))
pushMsg :: Chan -> Msg -> IO Chan pushMsg chan (Msg msgId msgContent) = Exception.evaluate $ let inserted = Map.insert msgId msgContent chan in if 200000 < Map.size inserted then Map.deleteMin inserted else inserted
main :: IO () main = Monad.foldM_ pushMsg Map.empty (map message [1..1000000])
We compiled and ran this program using:
$ ghc --version The Glorious Glasgow Haskell Compilation System, version 7.10.3 $ ghc -O2 -optc-O3 Main.hs $ ./Main +RTS -s 3,116,460,096 bytes allocated in the heap 385,101,600 bytes copied during GC 235,234,800 bytes maximum residency (14 sample(s)) 124,137,808 bytes maximum slop 600 MB total memory in use (0 MB lost due to fragmentation)
1Tot time (elapsed) Avg pause Max pause
Gen 0 6558 colls, 0 par 0.238s 0.280s 0.0000s 0.0012s Gen 1 14 colls, 0 par 0.179s 0.250s 0.0179s 0.0515s
INIT time 0.000s ( 0.000s elapsed) MUT time 0.652s ( 0.745s elapsed) GC time 0.417s ( 0.530s elapsed) EXIT time 0.010s ( 0.052s elapsed) Total time 1.079s ( 1.326s elapsed)
%GC time 38.6% (40.0% elapsed)
Alloc rate 4,780,213,353 bytes per MUT second
Productivity 61.4% of total user, 49.9% of total elapsed
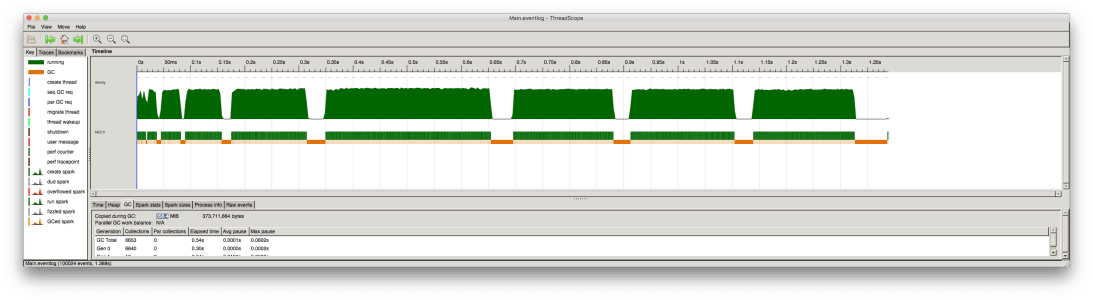
GHC’s runtime can output various statistics. Above, we print out garbage collection statistics with +RHS -s. The important metric in the result is the ‘max pause’ of 0.0515s, or 51 milliseconds. This program still exhibits the same garbage collection pauses when examined in ThreadScope:
We tried tweaking many variables to test their effects on this pause time, most of which had very little effect. Compiler optimization flags (-O, -O2) made little difference. GC options (-G, -H, -A, -c) made little difference (see below). Using different data structures made little difference (we also tried a Data.Sequence and a priority queue). Varying the size of messages made little difference (for reasons we’ll explain). Artificially increasing the amount of short-lived garbage did not increase the pause time (also for reasons we’ll explain).
Only one variable had a definite effect: the number of messages kept in the history. The relationship was roughly linear (or perhaps slightly worse):
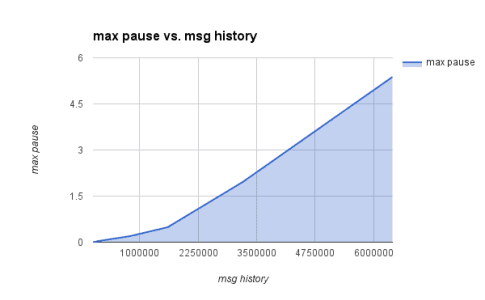
The message history in our program is our entire working set. The results above seemed to apply more generally to other programs: the size of the working set determined the length of the maximum pause. But why?
Understanding the GHC garbage collector
The first important thing to know is that GHC’s garbage collector is stop-the-world. A stop-the-world garbage collector flips between two phases: a normal process execution phase where garbage is generated, and a garbage collection phase where garbage is collected. These are the two phases seen in the ThreadScope view of our processes, and it is these periods where ‘the world is stopped’ which cause our latency problem.
The garbage collector is generational, which is an optimization to reduce the number of long collections on the entire heap. It organizes allocated objects into buckets by ��‘age’, where each bucket is called a ‘generation’. This allows GHC to perform frequent, small collections on just the young objects. Looking back at ThreadScope, you can see lots of little orange GC pauses between the problematic longer ones. While this generational design tends to improve throughput, it does not help our max-pause metric! The occasional full-heap collection in a generational collector is the same as a normal collection in a non-generational collector. It is here that we hit our worst case.
(Actually, the generational design does not improve our throughput much. It relies on the assumption that “most objects die young,” which is true of many programs. But in our use-case, most objects have the same lifetime: the time they spend in the buffer.)
Finally, you need to know that the GHC garbage collector is copying. This means it keeps two areas of memory: an active area holding all objects, and an inactive one. At each GC cycle, it flips the active and inactive areas, copying all accessible objects from the active area to the inactive area. Roughly, it does this by walking the object graph and copying each object it finds to the active area. (It actually uses a clever evacuate/scavenge algorithm, but the details are unimportant here. To see the nuts and bolts, this set of slides is great.)
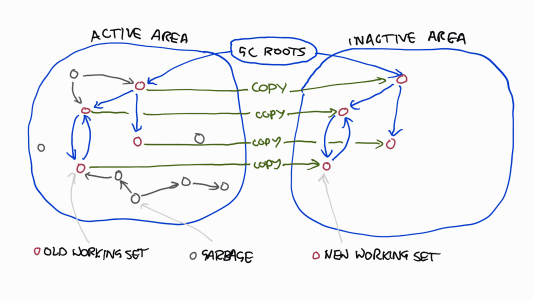
How long does it take to perform this copying routine on the entire heap? The object graph traversal takes time linear in the the number of object pointers in the working set. The copying takes time linear in the number of bytes. (Additionally, because objects reference each other via pointers, moving an object requires updating all pointers to it.)
Therefore it seems that GC pauses are proportional to the number of pointers in the working set plus the size of the working set. Which of these costs dominates? It depends on whether your heap is memory-heavy or pointer-heavy. In our case with messages of 1 kilobyte, the pointers seemed to dominate (changing the message size made little difference to pause times). Roughly, we can say that for a typical heap, GC pauses are proportional to the working set size.
Three non-fixes
At the beginning, we thought that since garbage collectors ‘work on garbage,’ we should reduce the amount of garbage to reduce the time taken. But the amount of generated garbage is actually irrelevant. This is because the garbage is the memory which is not touched by the copying algorithm: it takes up no time at all! This is a design decision in GHC. Functional languages like Haskell generate many short-lived objects. When the number of dead objects dwarfs the number of retained objects, it makes sense to operate on the smaller of the two sets! Reducing the amount of garbage was a non-fix for us.
We discovered that GHC’s garbage collector is parallel. This means that its garbage collection phases may exploit multiple cores to finish faster. It does not mean that garbage collection is concurrent with program execution! It turns out parallel collection was mostly irrelevant to the results here. At best, the speed-up is a constant factor, and for our particular use-case this constant factor was close to 1. Sadly, parallelism was a non-fix.
Finally, we discovered that the garbage collector can use a compacting algorithm instead of the copying algorithm. Instead of copying the working set into a new memory area, the compacting algorithm manipulates a single memory area, which potentially involves less copying. However, our experimentation showed that this was slower than the copying algorithm. This too was a non-fix.
It is likely that the compacting algorithm is slower due to immaturity. The Hotspot JVM, for example, takes a similar approach in collecting its older generations. In Hotspot, different approaches are taken to different generations. On the assumption that most new objects will be dead, the young generations use a copying algorithm. On the assumption that old objects will be retained, the old generations use a mark-and-sweep algorithm. This latter case is more complex to implement efficiently: you must retain free-lists of reclaimed memory, deal with fragmentation by merging these chunks, move objects which are standing in the way of merging nearby free chunks, and so on. Hotspot achieves impressive results here, but the person-decades of engineering poured into its implementation should not be underestimated.
After research and experimentation, our working theory was that the worst-case latencies in our message delivery were linear in the number of messages in the history, because each GC cycle has to walk over all the memory retained during a collection and copy it, which are clearly linear operations. At this point, we reached out on Stack Overflow with our conundrum. Within a few hours we received a definitive answer from Simon Marlow, the main author of GHC’s runtime system, who confirmed that our hypothesis was correct and that currently there is no way to work around this in GHC.
Conclusion
This post only repeats some basic information about GHC’s garbage collector. However, the implications of it may not be immediately obvious. We discovered in particular that its pause times relate linearly to the size of the working set (measured as a combination of byte size and object pointers). You may hear that GHC’s garbage collector is well-designed, and it is. But be sure to understand that it is designed for throughput, not latency. Understand also that it is optimised for programs where “most objects die young,” and not all programs fit this heuristic.
GHC cannot achieve low latency with a large working set. We are in the process of reimplementing our message bus with this lesson in mind. We’re exploring a few avenues for avoiding the problem. We plan to talk about the new implementation in a future blog post. Stay tuned!


© 2024 Pusher Ltd. All rights reserved.
Pusher Limited is a company registered in England and Wales (No. 07489873) whose registered office is at MessageBird UK Limited, 3 More London Riverside, 4th Floor, London, United Kingdom, SE1 2AQ.