- Products

- Developers
- User stories
- Blog
- Pricing

How to set up your Pusher and Datadog integration

Set up your Datadog integration with this mini tutorial, and get all your Pusher metrics (like messages and connections) in one place.
Introduction
Datadog, a monitoring platform that puts all your metrics in one place, is available to Pusher Pro plans and up.
Learn how to set up your Datadog integration with this mini tutorial, and get all those interesting Pusher metrics right in your dashboard.
Metrics examples
Connections metrics: if you use different connection types, or implement both public and private channels, you can get insights about where your users are connected.
Message metrics: break your messages down by type and see a range of message size stats in order to optimise your implementation.
Plus, interesting insights such as messages sent per connection.
Let’s get started!
First things first: get your Agent running in Datadog.
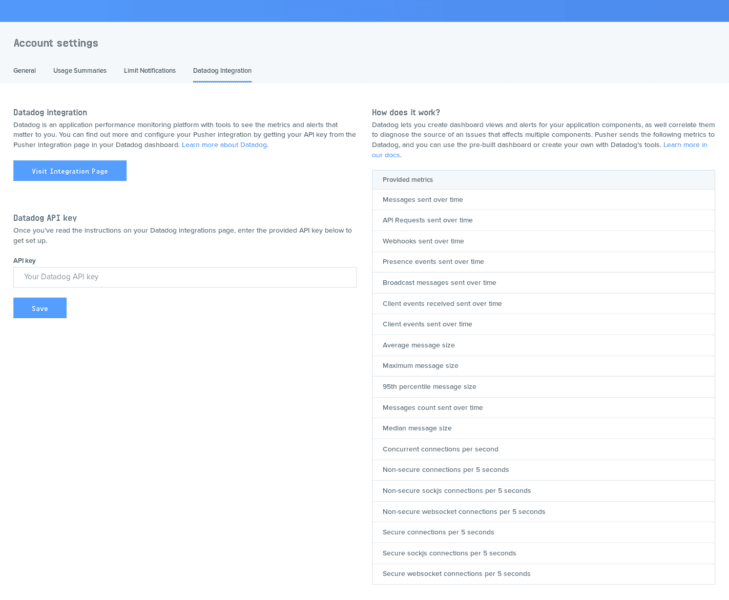
Then, get your API Key from Datadog, log in to Pusher and paste it in the dashboard.
Now go back to your Datadog dashboard.
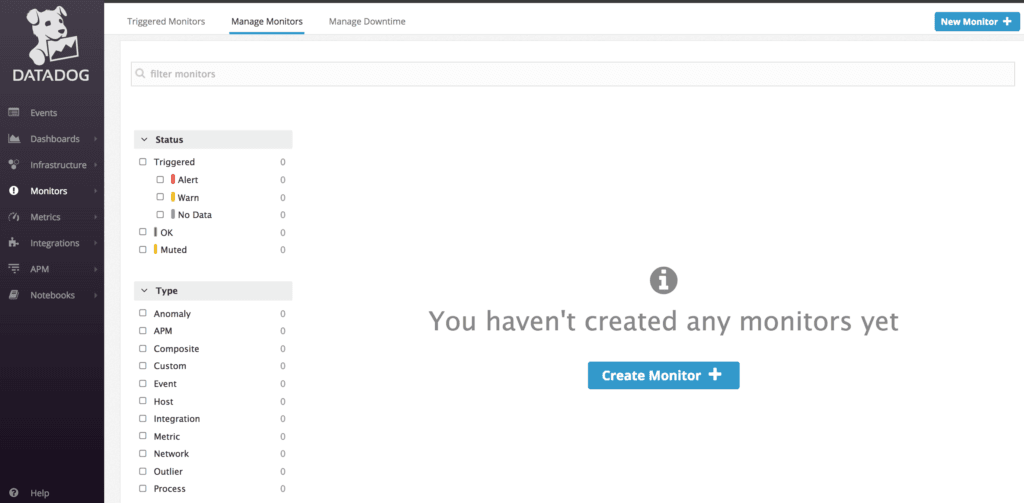
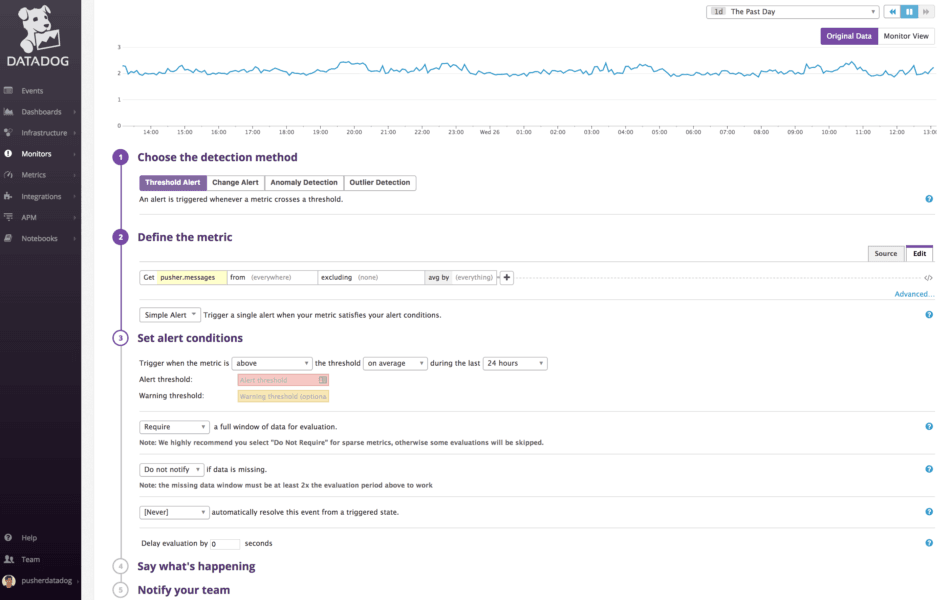
In the Monitors section in the sidebar select New Monitor.
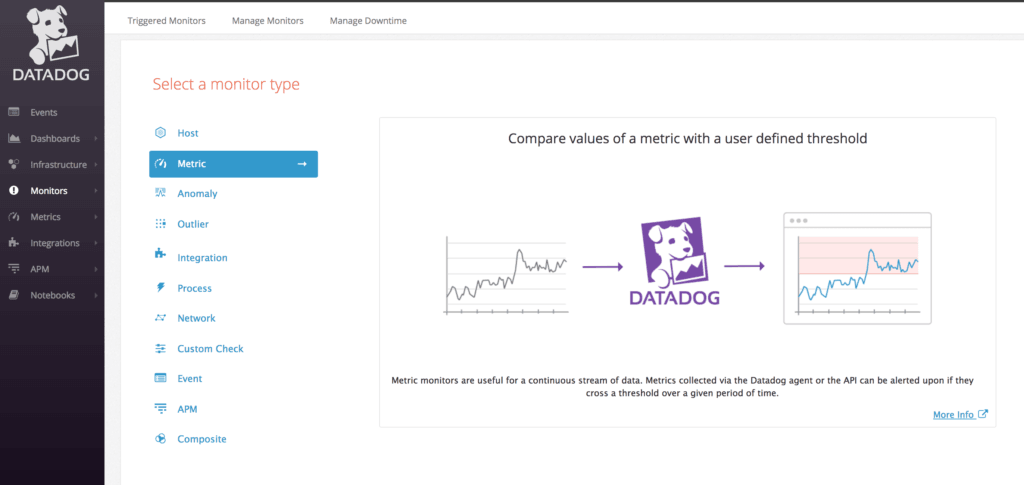
Select Metric as your monitor type.
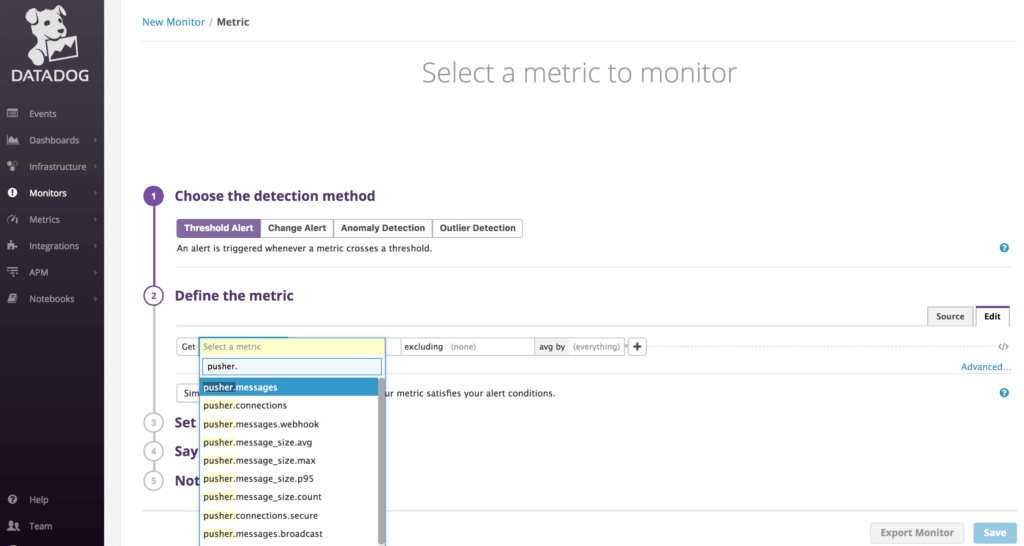
Select the Pusher Metric you would like to monitor, e.g. pusher.messages, which is the sum of all the messages you are sending with Pusher.
Configure the time period to measure, as well as the Warning and Alert thresholds. The graph will now represent the thresholds you have chosen.
You can edit the message that will be delivered to the team who is on call, and configure how frequently they will be notified if the issue is not resolved.
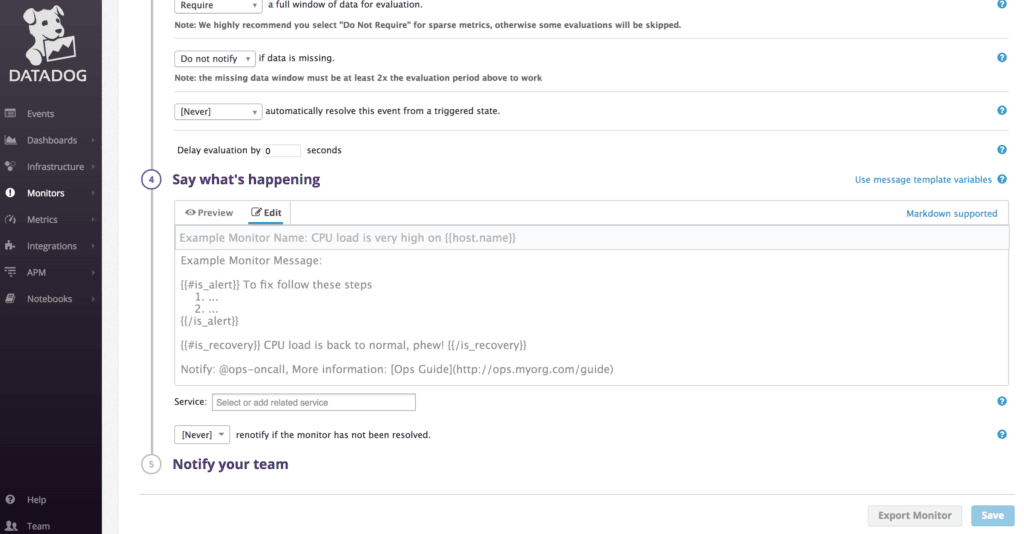
Click Save. You can change these settings later if you need to.
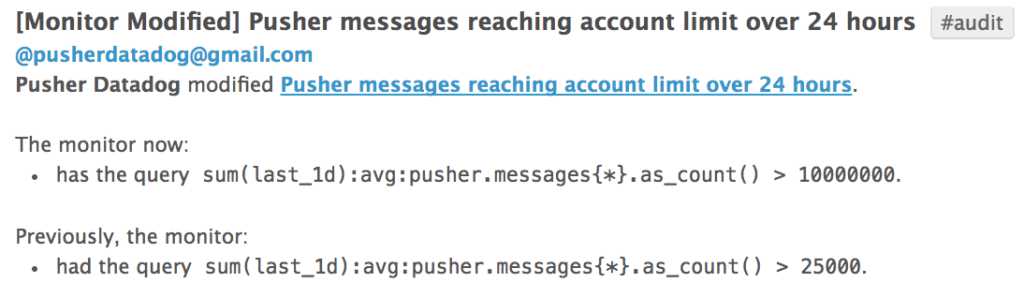
When the recipient receives the email, they can click Comment in Datadog to go to the issue and resolve it in their Event Stream.
The Pusher messages metrics in Datadog are broken down by message type (Broadcast, Client Event, Presence, Webhook, API) as well as size statistics (count, median, average, 95th percentile, maximum).
All metrics are populated in realtime, so your historical data will begin to populate once your integration is successfully completed.
For questions and feedback find us on Twitter @pusher or through support. We look forward to hearing from you!


© 2024 Pusher Ltd. All rights reserved.
Pusher Limited is a company registered in England and Wales (No. 07489873) whose registered office is at MessageBird UK Limited, 3 More London Riverside, 4th Floor, London, United Kingdom, SE1 2AQ.