- Products

- Developers
- User stories
- Blog
- Pricing

Dynamic Graphs with D3.js

D3 (Data-Driven Documents) is a JavaScript library commonly used for web-based visualisation. We’re going to use d3 to show how many clients are subscribed to a given channel.
Introduction
D3 (Data-Driven Documents) is a JavaScript library commonly used for web-based visualisation. It gives you tools to process and manipulate data and provides an intuitive way to bind that data to DOM nodes. Basically, it’s way cool.
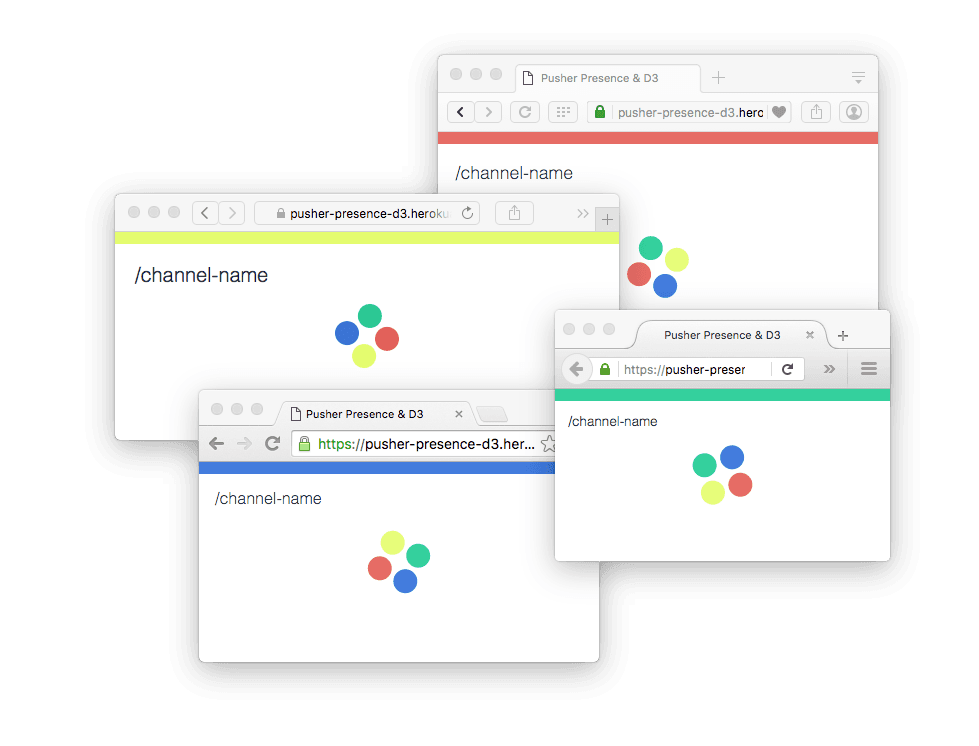
We’re going to use d3 to show how many clients are subscribed to a given channel. The visualisation will update automatically when a client connects or disconnects. It’s going to look something like this:
Making an
From a practical perspective, we’ll create an svg element with a series of circle elements to represent the connected clients.
So, first of all, let’s use d3 to create our root element:
1const w = window.innerWidth 2const h = window.innerHeight 3 4const svg = d3.select('body') 5 .append('svg') 6 .attr('width', w) 7 .attr('height', h)
Notice the const instead of var. We’re using ES2015 syntax here, so our final code will have to be run through a compiler like Babel to make it run on older browsers.
We’ve created an <svg> element by calling .append('svg'), and used .attr() to set the width and height attributes of that node. Our page will end up with the following markup:
1… <svg width="500" height="500"></svg> …
Which is a good start.
Adding some
Now we need some circles to represent the connected clients. We’ll write a function that will take an array of items and generate a set of matching <circle> nodes in the svg.
1let circles = svg.selectAll('circle') 2 3const update = (items) => { 4 circles = circles.data(items, d => d.id) 5 6 circles 7 .enter() 8 .append('circle') 9 .attr('fill', d => d.color) 10 .attr('r', 10) 11 12 circles 13 .exit() 14 .transition() 15 .attr('r', 0) 16 .remove() 17} 18 19/* 20 update([{id: 1, color: 'red'}, {id:2, color: 'blue'}]) 21*/
This is a bit more complex than adding the svg. First up, we create a selection, representing the list of <circle> elements.
We bind this selection to a dataset by calling .data on it. This returns a new selection, with sub-selections representing elements to be added or removed from the DOM. (Take a look at this post for a good introduction to selections, binding, and enter/exit elements.)
A nice thing about this is that our .attr methods can now reference the bound data; allowing us to set attributes & properties on the DOM node based on the properties of the associated data. For example, we’re setting the circle fill based on the .color property of our items.
Now, when we call update([{id:…, color:…}, …]), we’ll get something like this:
1<svg width="500" height="500"> 2 <circle r="10" fill="red"></circle> 3 <circle r="10" fill="blue"></circle> 4 … 5</svg>
…Which is great!
And, when we call it with an updated set of items, it’ll update efficiently; matching nodes will be updated, rather than re-appended or re-mapped.
However, our circles aren’t positioned; they’re all at the top left corner of the svg rather than bobbing around the middle.
Putting our
To assign positions for our circles, we can use the d3 force layout. This is a physics-inspired iterative layout that emulates charge and gravity to position nodes (as I said before, d3 is way cool).
1const force = d3.layout.force() 2 .size([w,h]) 3 .on('tick', () => 4 circle 5 .attr('cx', d => d.x) 6 .attr('cy', d => d.y) 7 ) 8 9// within our `update` function 10 force 11 .nodes(items) 12 .start()
We’ve initialised a force layout. The layout operates on the underlying array of objects – adding x/y properties to each object that can be used to position our elements. A force layout emits a tick event which is fired as the algorithm resolves to a steady state, by updating the circle positions at this point, we’ll get a smooth animation toward the new layout.
Now we just have to start the force layout, and our circles will transition toward the centre of the visualisation.
Adding real(time) data
Now we’re ready to plug in some actual data.
We’ll store the list of members of a channel in an array named channel_members, and write a couple of helper methods that add/remove members then update the graph we just created.
1let channel_members = [] 2 3 4/* 5 helpers for adding and removing members & updating the 6 graph with the new data 7*/ 8 9const addMember = (member) => { 10 11 channel_members.push({ 12 id: member.id, 13 color: member.info.color 14 }) 15 16 update(members) 17} 18 19const removeMember = (member) => { 20 21 channel_members = channel_members.filter(m => m.id != member.id) 22 23 update(members) 24}
To connect it up to a presence channel, we can use some special channel events:
member_added– fired when someone joinsmember_removed– fired when someone leaves the channelsubscription_succeeded– once the client has been successfully authenticated
All we have to do is hook these up to the addMember/removeMember functions that we just created.
1const pusher = new Pusher('OUR-KEY', {encrypted: true}) 2const channel = pusher.subscribe('presence-OUR-CHANNEL-NAME') 3 4channel 5 .bind('pusher:member_added', addMember) 6 .bind('pusher:member_removed', removeMember) 7 .bind('pusher:subscription_succeeded', members => members.each(addMember))
And there we have it! You can see a live version of the demo at pusher-presence-d3.herokuapp.com (open several windows with the same url to see it in action). The full code is on github, including a back end node app.
If you have any questions, comments, feedback, or other stuff – drop me a line on twitter (I’m @benjaminbenben).


© 2024 Pusher Ltd. All rights reserved.
Pusher Limited is a company registered in England and Wales (No. 07489873) whose registered office is at MessageBird UK Limited, 3 More London Riverside, 4th Floor, London, United Kingdom, SE1 2AQ.