- Products

- Developers
- User stories
- Blog
- Pricing

Announcing New Premium Pusher Metrics Sent to Datadog

You can now use Pusher integration with Datadog to create unique dashboard views, set up alerts, and monitor Pusher alongside metrics from other services.
Introduction
Update: As of August 2017, this is available to Pusher Pro plans and above. Here’s a step-by-step guide to complete the integration.
We’re excited to announce that Pusher is now an integration on Datadog. You can add Pusher as an integration on Datadog to easily monitor your realtime connections, messages, and message sizes. Of the 19 Pusher metrics sent to Datadog, 16 are new metrics for Pusher customers!
Datadog is an application performance monitoring platform that puts metrics from all of the services in your stack in one place, so you can easily monitor performance throughout the day, and set up health alerts for when you are away.
You can use Datadog’s Pusher integration to create unique dashboard views, set up alerts, and monitor Pusher alongside metrics from other services. The Datadog integration is only available on Pusher plans that are Pro and above. Add Pusher as an integration to get started!
Pusher Metrics
We are now offering more Pusher metrics than ever before. It’s simple to view all metrics aggregated across your account, or you can drill down by Pusher App_ID. Metrics are aggregated and sent every 5 seconds, and will begin populating your history on Datadog within a few minutes of setting up the integration.
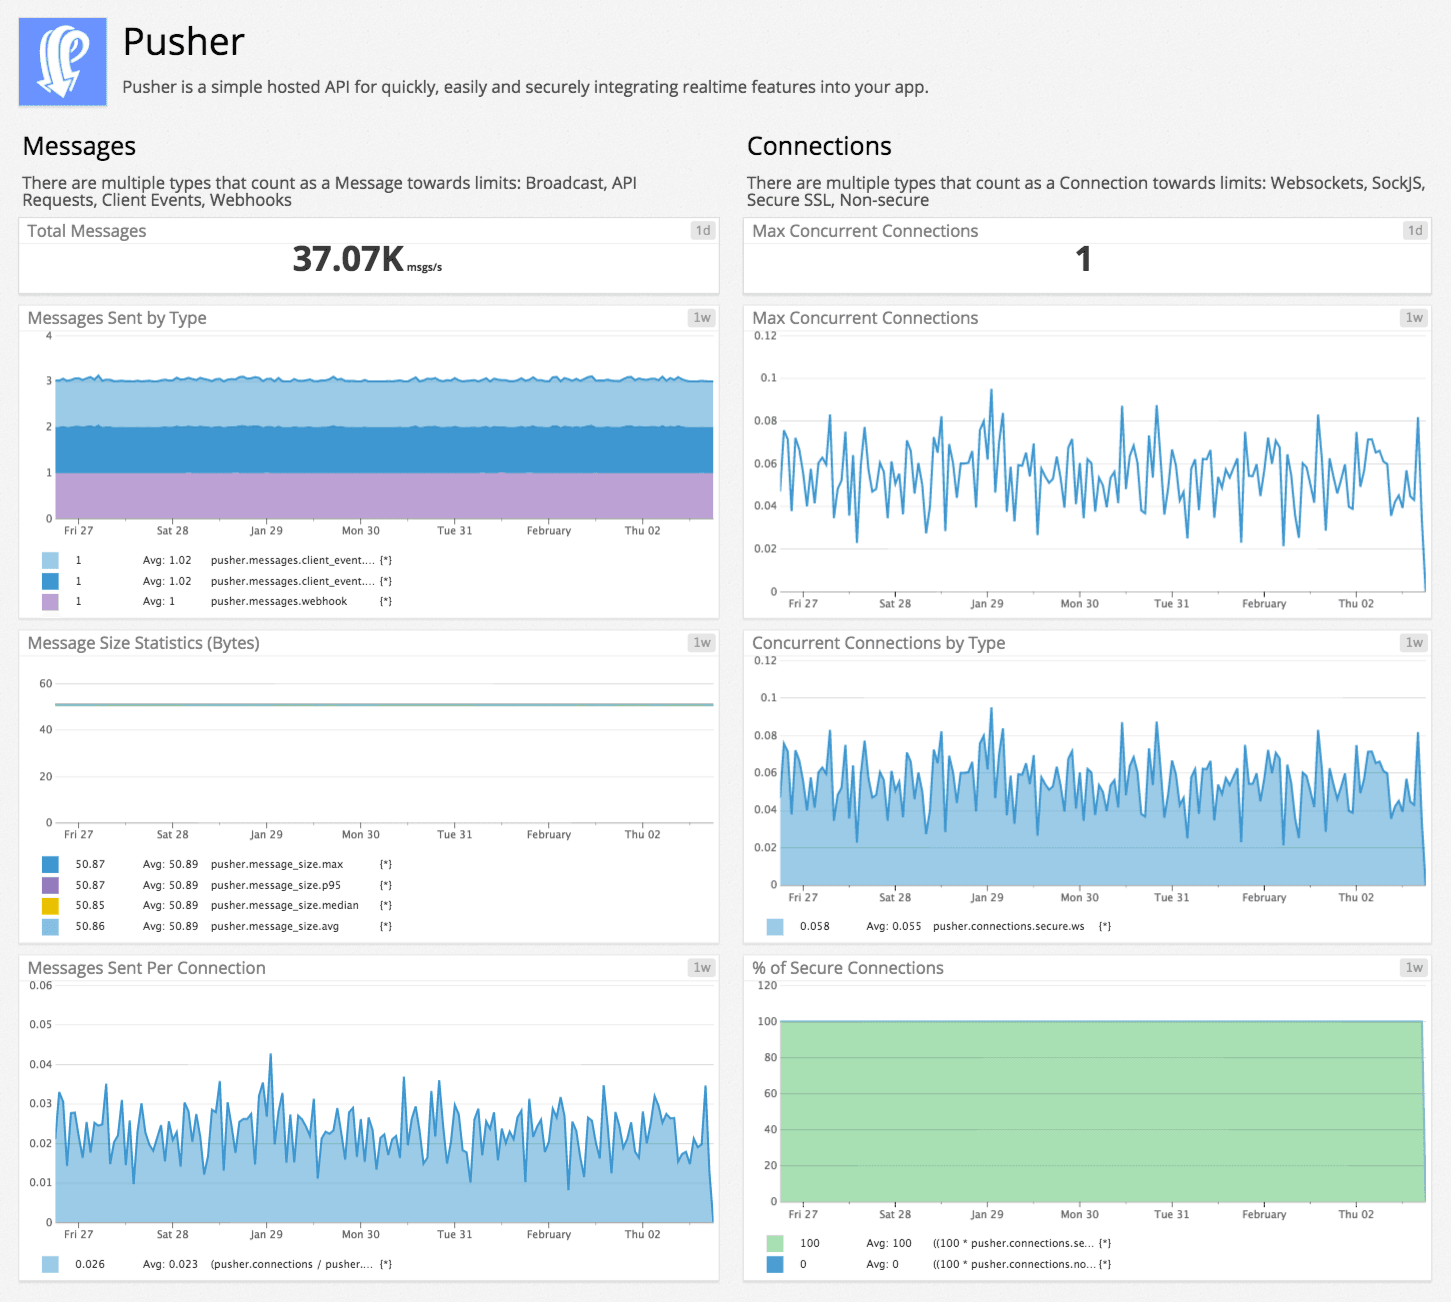
Connections Metrics
The metrics related to Connections often resemble a model of your current user engagement at any point in time. If you use different connection types, or implement both public and private channels, you can get insights about where your users are connected.
The Pusher connections metrics on Datadog are broken down by connection type (Websocket, SockJS) as well as security (SSL, Non-SSL).
Messages Metrics
Pusher Messages represent the realtime activity across your app. There are different message types for different purposes, such as Presence events which are useful for displaying which users are currently connected. You can now break your messages down by type and see a range of message size stats in order to optimise your implementation.
The Pusher messages metrics on Datadog are broken down by message type (Broadcast, Client Event, Presence, Webhook, API) as well as size statistics (Count, Median, Average, 95th Percentile, Maximum).
New Pusher Insights
With Datadog’s ability to correlate metrics in interesting ways, you can now get new insights about your Pusher traffic which weren’t available before, such as the messages sent per connection. You can also correlate Pusher metrics with related metrics from other services in your stack to create graphs that were never possible until now.
We are excited to roll out this initial set of metrics, and we look forward to hearing your feedback on Twitter, @pusher or through support about the integration or new metrics you’d like to see in the future.


© 2024 Pusher Ltd. All rights reserved.
Pusher Limited is a company registered in England and Wales (No. 07489873) whose registered office is at MessageBird UK Limited, 3 More London Riverside, 4th Floor, London, United Kingdom, SE1 2AQ.